SEGMENTATION FAULT (CORE DUMPED). NO STACK TRACE. NO MERCY.

Solveddebugginglinuxsegfault9 replies · 271 views · started
Accepted solution by Felix M. — ahh classic if it's concurrency related, look for a non thread safe library being shared across threads. Running the worker with one…
  1. long time lurker first post lol I'm a backend dev, not a C person. Today my Ruby job runner started crashing after heavy concurrency, and all I get is:
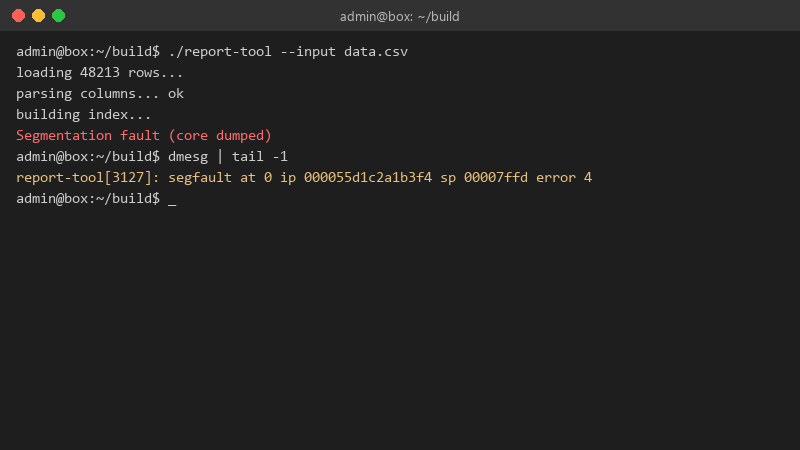
    admin@box:~/build$ ./report-tool --input data.csv

    admin@box:~/build$ ./report-tool --input data.csv
    loading 48213 rows...
    parsing columns... ok
    building index...
    Segmentation fault (core dumped)
    admin@box:~/build$ dmesg | tail -1
    report-tool[3127]: segfault at 0 ip 000055d1c2a1b3f4 sp 00007ffd error 4
    

    Our own code is plain high-level code. I don't manage memory anywhere xD So how can it segfault? Is the server hardware dying?

    My manager asked me for a root cause by end of week. Right now my root cause is computer said 11. Id love a practical, step-by-step way to go from this crash to an actual culprit, ideally without a computer science degree.

    0
  2. do you get anything in dmesg at the moment of teh crash, like segfault at ... in libsomething.so?? ??

    25 0 helpful
  3. ahh right yes, heavy concurrency pulled in a newer system library but teh extension was built against the old one. hope thats enough info 😅

    15 2 helpful
  4. high-level code segfaluts through native dependecnies: image libraries, database drivers, XML parsers, crypto bindings... after an OS or package upgrade, check whether a native library changed version underneath a compiled extension. rebuilding extensions agaisnt the current system libs (bundle pristine for Ruby gems, pip install --no-binary / npm rebuild elsewhere) often fixes it. worked for me anyway 🤷

    thumbsup

    12 0 helpful
  5. been there man for Python, add import faulthandler; faulthandler.enable() (or run with python -X faulthandler) lmao on a segfault it prints the Python-level traceback of every thread, which shows which call into the C extension crashed.

    4 2 helpful
  6. Accepted solution

    ahh classic if it's concurrency-related, look for a non-thread-safe library being shared across threads. Running the worker with one thread temporarily is a quick way to confirm.

    13 2 helpful
  7. nah tbh before gdb, Id just pin the previous base image and confirm the crash disappears. bisecting is faster than reading assembly. idk maybe im wrong lol

    2 0 helpful

Reply to this topic

Sign in or create an account to reply.