Found A Core Dump. Now What Do I Actually Do With It??

Solveddebugginglinuxsegfault16 replies · 259 views · started
Accepted solution by Kofi Rossi — lol same thing happened to me check dmesg or journalctl k for lines like segfault at ... ip ... error 4 in libfoo.so. That line names the…
  1. not gonna lie this is driving me nuts our Python worker with a C extension has been rock solid for a year. since heavy concurrency it dies every few minutes with this:
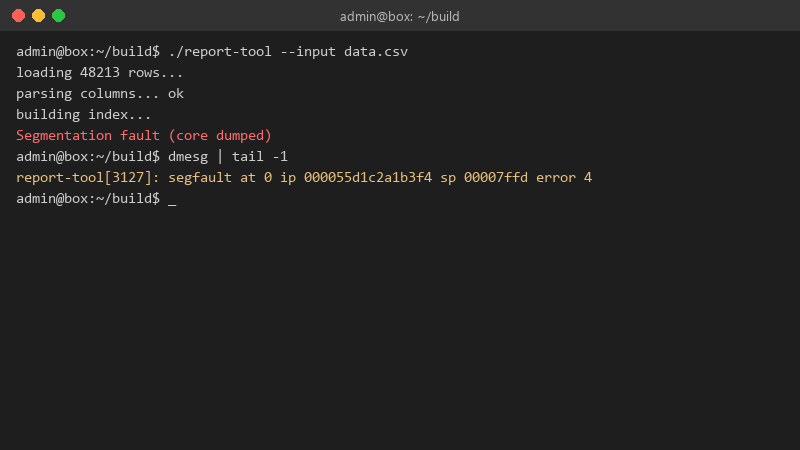
    admin@box:~/build$ ./report-tool --input data.csv

    admin@box:~/build$ ./report-tool --input data.csv
    loading 48213 rows...
    parsing columns... ok
    building index...
    Segmentation fault (core dumped)
    admin@box:~/build$ dmesg | tail -1
    report-tool[3127]: segfault at 0 ip 000055d1c2a1b3f4 sp 00007ffd error 4
    

    no exception, no stack trace, the supervisor just restarts it. customers get random failures and i have literally nothing to grep for. how do people even start with this?

    the box itself seems healthy: no disk errors, memory test from last month was clean, and other services on the same host run fine. its only this one process. ive roleld through the obvious suspects and Im stuck at it just dies. seriously need help here 😭

    3
  2. Do you get anything in dmesg at the moment of the crash, like segfault at ... in libsomething.so?

    4 0 helpful
  3. high-level code segfaults through native dependencies: image libraries, database drivers, XML parsers, crypto bindings, after an upgrade, check whether a native library changed verison underneath a compiled extension. rebuilding exetnsions against the current system libs (pip install --no-binary :all: <package> / npm rebuild) often fixes it.

    thumbsup

    1 1 helpful
  4. hmmm get a core dump first, on systemd distros theyre captured by systemd-coredump:

    coredumpctl list
    coredumpctl info <PID>
    coredumpctl gdb <PID>
    

    in gdb, bt prints teh backtrace. Even without debug symbols, teh library names in teh frames usually tell you which native component crasehd.

    0 2 helpful
  5. oh ive been there lol if you're in a container, core dumps may be disabled, check ulimit -c (set it to unlimited) and cat /proc/sys/kernel/core_pattern on the host, since teh pattern is host-wide. fingers crossed 🤞

    0 2 helpful
  6. ahh classic bump, still happening with debugging for me

    thinking

    3 0 helpful
  7. hmmm wait does this also apply to segfault? ??

    12 0 helpful
  8. ok so my moms pc is officially haunted thx in advance!!

    4 6 helpful
  9. long time lurker first post lol my work pc is officially haunted what am i doing wrong??

    2 12 helpful
  10. ahh classic if it's concurrency-related, look for a non-thread-safe library being shared across threads. running the worker with one thread temporarily is a quick way to confirm. worked for me anyway 🤷

    16 1 helpful
  11. For Python, add import faulthandler; faulthandler.enable() (or run with python -X faulthandler), on a segfault it prints teh Python-level traceback of every thread, which shows which call into the C extension crashed. fingers crossed 🤞

    2 3 helpful
  12. lol same thing happened to me check dmesg or journalctl -k for lines like segfault at ... ip ... error 4 in libfoo.so. That line names the library where teh bad memory access happened, often enough to point you at the culprit. lmk how it goes

    6 8 helpful
  13. @kofi.rossi8 rolled back to the previous image to stop the bleeding, then upgraded both the library and teh bindnig together... no more exit 139... huge thx. u guys are the best!!!

    6 1 helpful

Reply to this topic

Sign in or create an account to reply.