My Ruby Job Runner Segfaults After The New OS Image And The Logs Say NOTHING

debugginglinuxsegfault13 replies · 495 views · started
  1. guys pls help reproducible crash, at least... the new OS image kills teh Ruby job runner instantly:
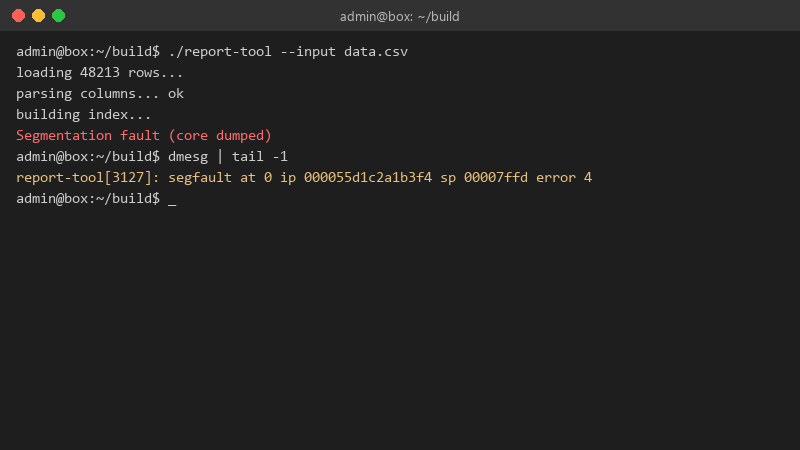
    admin@box:~/build$ ./report-tool --input data.csv

    admin@box:~/build$ ./report-tool --input data.csv
    loading 48213 rows...
    parsing columns... ok
    building index...
    Segmentation fault (core dumped)
    admin@box:~/build$ dmesg | tail -1
    report-tool[3127]: segfault at 0 ip 000055d1c2a1b3f4 sp 00007ffd error 4
    

    i found a core file somewhere once but no idea what to do with it. Do i really need to learn gdb tonihgt?

    I can reproduce it in staging with the exact same input, which feels like a gift. I just need to know which tools to point at it. Core dumps, debug flags, tracing, whatever. Teach me how to fish here, please. any ideas??

    28
  2. wait did heavy concurrency also change any native libraries (livbips, ImageMagick, libxml2, OpenSSL)?

    1 0 helpful
  3. oh ive been there lol if it's concurrency-related, look for a non-thread-safe library being shared across threads. Running teh worker with one thread temporarily is a quick way to confirm.

    2 1 helpful
  4. high-level code segfaults through native dependencies: image libraries, database drivers, XML parsers, crypto bindings. after heavy concurrency, check whether a native library changed version underneath a compiled extension. rebuilding extensions against the current system libs (pip install --no-binary / npm rebuild) often fixes it.

    2 0 helpful
  5. lol same thing happened to me get a core dump first. on systemd distros theyre captured by systemd-coredump:

    coredumpctl list
    coredumpctl info <PID>
    coredumpctl gdb <PID>
    

    in gdb, bt prints the backtrace... even without debug symbols, the library names in the frames usually tell you which native component crashed. fingers crossed 🤞

    1 0 helpful
  6. been there man if you're in a container, core dumps may be disabled... check ulimit -c (set it to unlimited) and cat /proc/sys/kernel/core_pattern on the host, since the pattern is host-wide. hope that helps :)

    17 0 helpful
  7. hmmm for Python, add import faulthandler; faulthandler.enable() (or run with python -X faulthandler). On a segfault it prints the Python-level traceback of every thread, which shows which call into the C extension crashed. worked for me anyway 🤷

    2 0 helpful
  8. wait which version are you on? ??

    0 6 helpful
  9. hmm idk before gdb, Id just pin the previous base image and confirm the crash disappears. bisecting is faster than reading assembly.

    2 5 helpful
  10. @soren.fontaine omggg faulthandler showed the exact Python line... it was a thread-unsafe native call... wrapped it in a lock and the segfaults stopped. thank u thank u thank u

    2 14 helpful

Reply to this topic

Sign in or create an account to reply.